Daily Relo Ticker-April 14, 2026: What 40 Years of Data Says About 2026 Market
- Martin Mayotte
- Apr 14
- 4 min read

Daily Relo Ticker
Welcome to today’s Daily Relo Ticker (DRT)- your quick, straightforward update on the relocation world as of April 2026. A trusted source, pairing 15+ years of industry experience and over a dozen of personal moves. Listed below are topics, trends and current job postings in the industry. Please consider sharing for maximum reach and while there are no royalties, kickbacks or fees, any move related referral would be greatly appreciated!

Featured News: Status Of Home Improvement
40 years of US housing data (roughly 1986–2026) reveals clear long-term patterns: steady nominal price appreciation with periodic cycles driven by interest rates, supply constraints, economic shocks, and credit conditions.
The market is resilient over decades but volatile short-term, with booms correcting via slower sales more often than outright national price crashes (the 2008 episode being an outlier tied to a credit bubble).
The question many home buyers/sellers are thinking "When will we see widespread price declines"?

40 Year Review
1980s–1990s: High mortgage rates (often 10–16%+) in the early 1980s slowed growth; a mild 1990–91 recession caused regional dips or flat prices. Overall steady growth.
2000s: Classic boom-bust. Prices roughly doubled 2000–2006, then fell ~30–35% nationally by 2012 amid the global financial crisis (GFC).
2010s: Steady post-GFC recovery (~4–6% annual nominal gains) fueled by low rates and underbuilding.
2020–2022: Pandemic super-cycle (+~40–50% in ~2 years) from ultra-low rates (~3%), remote work, and demand surge.
2023–2026 (so far): Rate hikes to 6–7%+ slowed momentum. Nominal prices held or grew modestly (1–6% YoY recently), but real (inflation-adjusted) gains flattened or turned slightly negative in spots
Short Story: 2020's were trending similar to 2000's with rising home prices. Higher mortgage rates were needed to cool increases (where we are today) and higher interest rates were establish to promote steady growth, similar to what we saw post GFC.
Price Projections: To promote steady price increases, we should expect a slight dip in prices, with mortgage rates remaining steady. However, depending on region/area, home prices could see an increase
If there's no significant price decline, the next question/pattern buyers and sellers are thinking "Will we see a sharp decline in homes not selling"?
40 Year Review
40 year patterns indicate an average of 4-4.5 million homes sold annually, before the global financial crisis, which peaked near to 7 million in 2005.
While backlog of demand hit 6 million units sold in 2021, we seem to normalize at 4 million units annually, even amid high rates and declining population.
Short Summary: We seem to be back at normal patterns, so those planning to sit and wait it out, but want or need to move, should not hold their breath for a bust.
Sales Predictions: Unless we see mortgage rates fall before summer (doubtful) we should expect around 4 million units sold. 2027 or 2028 could see a housing boom if mortgage rates fall (even slightly).
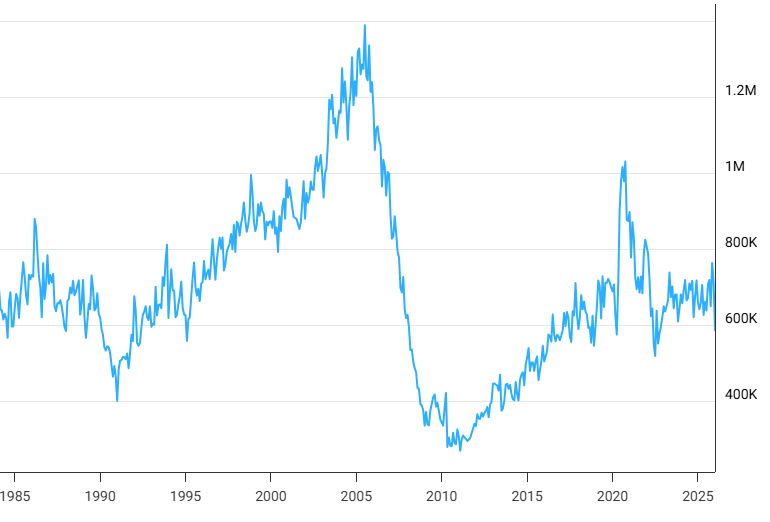
If there's no significant price declines, if homes sold have normalized, the last question many home buyers/sellers are thinking is "Will inventory help/hurt decisions"?

40 Year Review
Over the past 40 years, inventory has varied significantly, however, when we saw a spike in number of units sold, there was a dip in the number of listings/inventory available.
It's important to recognize that comprehensive national historical data on new listings or active listings over the full past 40 years is limited because consistent tracking (e.g., via Realtor.com or MLS aggregates) only became widely available in recent decades. Earlier data often relies on proxies like existing home sales volume, which reflects turnover in the market.
With that said, inventory was generally higher in the 1980s–2000s (often several million units available) but has trended lower in recent decades due to factors like low new construction relative to demand, homeowner "lock-in" from low mortgage rates, and strong buyer competition.
Short Summary:
We are tracking closer to 2020 (before the pandemic) than we did in 2025 and 2024. If history repeats itself, the following year (2021) saw significant growth, meaning 2027 could significantly see fewer homes available.
March 2021: 450k inventory for sale
March 2026: 964k inventory for sale
Sales Predictions: With 500k more units available than 5 years ago, we should not expect a year similar to 2021 (in terms of homes sold) and should expect similar a year similar to 2025.


Joke Of The Day:
I was going to tell you a joke about waiting... but I’ll finish it later
Moving Tip Of The Day:
While waiting for the truck, ensure all walkways are clear of debris; this speeds up the movers and lowers your final cost.
Trivia Of The Day:
Research from Medium shows that occupied time feels shorter than unoccupied time, which is why businesses put magazines in waiting rooms.
Quote Of The Day:
"Patience is not simply the ability to wait—it's how we behave while we're waiting." — Joyce Meyer.
Comments